问题背景
某台机器hardlockup导致宕机,需要排查宕机原因。
如果没有AI辅助,本次排查问题的学习成本+时间成本+排查难度都将翻倍,因此,Assisted-by: GPT-5.6。
背景知识
- hardlockup
内核态一直执行超过XXX秒,不能触发调度和响应中断,watchdog检测到后触发宕机。 - console_sem的handover机制
当CPU A持有console_sem时,它会先将自身标记为console_owner,然后开始打印。若此时CPU B也想打印并发现锁被占用,它会将console_waiter置为true并进入关中断自旋等待。A在每次写操作后都会检查console_waiter,一旦发现B在等待,A便立即清除console_waiter并直接退出(但不释放console_sem)。B检测到console_waiter被清除后随即停止自旋,并直接继承锁的控制权,成为新的console_owner,继续完成后续打印工作。 - printk_cpu_sync
用于在多 CPU 间串行化打印操作的专用同步机制,具有cpu可重入性并且可以在任意上下文中使用。最早叫printk_cpulock,可参见faebd693c593 (“printk: rename cpulock functions”)。 - fb_flashcursor
delayed_work周期性触发,管理控制台的光标闪烁等状态。
排查过程
初步判断
首先看一下宕机前的log,发现有创建很多pod的操作,创建pod就会创建veth,创建并初始化veth的时候需要向内核申请页面。
log中有多条页面分配失败的信息。
[10365589.875168] cptp: page allocation failure: order:7, mode:0x40dc0(GFP_KERNEL|__GFP_COMP|__GFP_ZERO), nodemask=(null),cpuset=containerd.service,mems_allowed=0-1
[10368797.966935] cptp: page allocation failure: order:7, mode:0x40dc0(GFP_KERNEL|__GFP_COMP|__GFP_ZERO), nodemask=(null),cpuset=containerd.service,mems_allowed=0-1
[10368813.289827] cptp: page allocation failure: order:7, mode:0x40dc0(GFP_KERNEL|__GFP_COMP|__GFP_ZERO), nodemask=(null),cpuset=containerd.service,mems_allowed=0-1
[yzwddsg@XXXXX 5.14.0-427.42.1.el9_4.x86_64]$ cat vmcore-dmesg.txt |grep 'age allocation failure' |wc -l
334
看一下当时确实没有多少高阶内存了.
[10368798.554198] Node 0 DMA: 0*4kB 0*8kB 0*16kB 0*32kB 0*64kB 0*128kB 0*256kB 0*512kB 1*1024kB (U) 1*2048kB (M) 2*4096
kB (M) = 11264kB
[10368798.568724] Node 0 DMA32: 12*4kB (UM) 5*8kB (M) 7*16kB (M) 7*32kB (M) 9*64kB (M) 4*128kB (M) 8*256kB (M) 7*512kB
(M) 6*1024kB (M) 6*2048kB (UM) 445*4096kB (M) = 1848296kB
[10368798.587239] Node 0 Normal: 50484*4kB (UME) 44379*8kB (UME) 21282*16kB (UMEH) 47195*32kB (UMEH) 5*64kB (MH) 0*128k
B 0*256kB 0*512kB 0*1024kB 0*2048kB 0*4096kB = 2408040kB
[10368798.605858] Node 1 Normal: 41969*4kB (UMEH) 72919*8kB (UMEH) 41149*16kB (UMEH) 30135*32kB (UMEH) 404*64kB (UME) 5
*128kB (U) 0*256kB 0*512kB 0*1024kB 0*2048kB 0*4096kB = 2400428kB
然后看一下宕机前的栈(NMI后面的就不贴了节省空间),这里可以大概看出,初始化veth的时候,申请页面,走了慢路径,然后warn_alloc打印一些警告信息,然后就宕机了。那么哪怕是分配不出页面也不至于造成hardlockup宕机吧?
[10368956.210951]  <TASK>
[10368956.210951]  _printk+0x58/0x73
[10368956.210953]  dump_stack_print_info+0x7c/0xb0
[10368956.210954]  dump_stack_lvl+0x28/0x48
[10368956.210956]  warn_alloc+0x138/0x160
[10368956.210957]  ? __alloc_pages_direct_compact+0x1f1/0x280
[10368956.210958]  __alloc_pages_slowpath.constprop.0+0x8ac/0x960
[10368956.210959]  ? get_page_from_freelist+0x2ab/0x530
[10368956.210961]  ? veth_dev_init+0x78/0xf0 [veth]
[10368956.210963]  __alloc_pages+0x21d/0x250
[10368956.210964]  __kmalloc_large_node+0x79/0x100
[10368956.210965]  __kmalloc+0xca/0x140
[10368956.210966]  veth_dev_init+0x78/0xf0 [veth]
[10368956.210967]  register_netdevice+0x10d/0x620
[10368956.210969]  veth_newlink+0x169/0x3e0 [veth]
[10368956.210973]  __rtnl_newlink+0x722/0x9e0
[10368956.210975]  ? update_sg_lb_stats+0x7e/0x450
[10368956.210977]  ? xas_load+0x9/0xa0
[10368956.210977]  ? xas_load+0x9/0xa0
[10368956.210978]  ? xa_load+0x70/0xb0
[10368956.210981]  rtnl_newlink+0x44/0x70
[10368956.210982]  rtnetlink_rcv_msg+0x159/0x3d0
[10368956.210983]  ? rmqueue+0x7d3/0xd40
[10368956.210984]  ? pick_link+0x24b/0x430
[10368956.210985]  ? task_dump_owner+0x9e/0x100
[10368956.210986]  ? __pfx_rtnetlink_rcv_msg+0x10/0x10
[10368956.210987]  netlink_rcv_skb+0x54/0x100
[10368956.210990]  netlink_unicast+0x23b/0x360
[10368956.210991]  netlink_sendmsg+0x24c/0x4c0
[10368956.210993]  __sys_sendto+0x1dc/0x1f0
[10368956.210994]  ? do_anonymous_page+0x27a/0x4c0
[10368956.210996]  __x64_sys_sendto+0x20/0x30
[10368956.210997]  do_syscall_64+0x59/0x90
[10368956.210998]  ? do_user_addr_fault+0x1d6/0x6a0
[10368956.210999]  ? do_syscall_64+0x69/0x90
[10368956.211000]  ? exc_page_fault+0x62/0x150
[10368956.211001]  entry_SYSCALL_64_after_hwframe+0x77/0xe1
[10368956.211002] RIP: 0033:0x40328e
[10368956.211004] Code: 48 89 6c 24 38 48 8d 6c 24 38 e8 0d 00 00 00 48 8b 6c 24 38 48 83 c4 40 c3 cc cc cc 49 89 f2 48
 89 fa 48 89 ce 48 89 df 0f 05 <48> 3d 01 f0 ff ff 76 15 48 f7 d8 48 89 c1 48 c7 c0 ff ff ff ff 48
[10368956.211005] RSP: 002b:000000c00040ee40 EFLAGS: 00000206 ORIG_RAX: 000000000000002c
[10368956.211006] RAX: ffffffffffffffda RBX: 000000000000000a RCX: 000000000040328e
[10368956.211006] RDX: 000000000000008c RSI: 000000c000592000 RDI: 000000000000000a
[10368956.211007] RBP: 000000c00040ee80 R08: 000000c00058e01c R09: 000000000000000c
[10368956.211007] R10: 0000000000000000 R11: 0000000000000206 R12: 0000000000000000
[10368956.211008] R13: 0000000000000040 R14: 000000c000585d40 R15: 000000c000780000
[10368956.211009]  </TASK>
vmcore分析
首先看一下当前hardlockup导致宕机的栈,可以看到最后在执行kernel/printk/printk.c: 2046。
crash> bt
PID: 3365527  TASK: ff1634946440c680  CPU: 334  COMMAND: "cptp"
 #0 [fffffe122c54fa90] machine_kexec at ffffffff87a782e7
 #1 [fffffe122c54fae8] __crash_kexec at ffffffff87bef95a
 #2 [fffffe122c54fba8] panic at ffffffff8862b8b1
 #3 [fffffe122c54fc30] watchdog_overflow_callback at ffffffff87c32a6f
 #4 [fffffe122c54fc48] __perf_event_overflow at ffffffff87d11982
 #5 [fffffe122c54fc78] amd_pmu_v2_handle_irq at ffffffff87a09a6f
 #6 [fffffe122c54fe48] perf_event_nmi_handler at ffffffff87a04c98
 #7 [fffffe122c54fe68] nmi_handle at ffffffff87a3005b
 #8 [fffffe122c54feb0] default_do_nmi at ffffffff88682fc0
 #9 [fffffe122c54fed0] exc_nmi at ffffffff886831bf
#10 [fffffe122c54fef0] end_repeat_nmi at ffffffff888016e9
    [exception RIP: vprintk_emit+436]
    RIP: ffffffff87b93174  RSP: ff49b5b4e83870b8  RFLAGS: 00000002
    RAX: 0000000000000001  RBX: 0000000000000046  RCX: 000000000001c5a2
    RDX: ff1634946440c680  RSI: 0000000000000002  RDI: ffffffff8a4a8f58
    RBP: 00000000ffffffff   R8: 8000000100009736   R9: ff16353f79902f27
    R10: ffffffffffffffff  R11: 000000000000007a  R12: 0000000000000000
    R13: 0000000000000000  R14: ffffffff88f87460  R15: 0000000000000078
    ORIG_RAX: ffffffffffffffff  CS: 0010  SS: 0018
--- <NMI exception stack> ---
#11 [ff49b5b4e83870b8] vprintk_emit at ffffffff87b93174
#12 [ff49b5b4e83870f8] _printk at ffffffff88631e18
#13 [ff49b5b4e8387158] dump_stack_print_info at ffffffff880594ac
#14 [ff49b5b4e83871a0] dump_stack_lvl at ffffffff8864a0b9
#15 [ff49b5b4e83871b8] warn_alloc at ffffffff87daadb8
#16 [ff49b5b4e8387260] __alloc_pages_slowpath.constprop.0 at ffffffff87dab69c
#17 [ff49b5b4e8387330] __alloc_pages at ffffffff87dab97d
#18 [ff49b5b4e8387390] __kmalloc_large_node at ffffffff87d69499
#19 [ff49b5b4e83873c8] __kmalloc at ffffffff87d6997a
#20 [ff49b5b4e83873f8] veth_dev_init at ffffffffc16d9e48 [veth]
#21 [ff49b5b4e8387410] register_netdevice at ffffffff8840653d
#22 [ff49b5b4e8387448] veth_newlink at ffffffffc16daa89 [veth]
#23 [ff49b5b4e83876b8] __rtnl_newlink at ffffffff88417352
#24 [ff49b5b4e8387b20] rtnl_newlink at ffffffff88417664
#25 [ff49b5b4e8387b48] rtnetlink_rcv_msg at ffffffff884142a9
#26 [ff49b5b4e8387bd8] netlink_rcv_skb at ffffffff8847e454
#27 [ff49b5b4e8387cb8] netlink_unicast at ffffffff8847dbab
#28 [ff49b5b4e8387d08] netlink_sendmsg at ffffffff8847df2c
#29 [ff49b5b4e8387d80] __sys_sendto at ffffffff883d274c
#30 [ff49b5b4e8387ec0] __x64_sys_sendto at ffffffff883d2790
#31 [ff49b5b4e8387ec8] do_syscall_64 at ffffffff88681459
#32 [ff49b5b4e8387f50] entry_SYSCALL_64_after_hwframe at ffffffff8880012f
    RIP: 000000000040328e  RSP: 000000c00040ee40  RFLAGS: 00000206
    RAX: ffffffffffffffda  RBX: 000000000000000a  RCX: 000000000040328e
    RDX: 000000000000008c  RSI: 000000c000592000  RDI: 000000000000000a
    RBP: 000000c00040ee80   R8: 000000c00058e01c   R9: 000000000000000c
    R10: 0000000000000000  R11: 0000000000000206  R12: 0000000000000000
    R13: 0000000000000040  R14: 000000c000585d40  R15: 000000c000780000
    ORIG_RAX: 000000000000002c  CS: 0033  SS: 002b


crash> dis -lr ffffffff87b93174 |tail
0xffffffff87b9315b <vprintk_emit+411>:	call   0xffffffff88697d80 <_raw_spin_unlock>
/usr/src/debug/kernel-5.14.0-427.42.1.el9_4/linux-5.14.0-427.42.1.el9_4.x86_64/kernel/printk/printk.c: 2046
0xffffffff87b93160 <vprintk_emit+416>:	movzbl 0x2915de8(%rip),%eax        # 0xffffffff8a4a8f4f <console_waiter>
0xffffffff87b93167 <vprintk_emit+423>:	test   %al,%al
0xffffffff87b93169 <vprintk_emit+425>:	je     0xffffffff87b93178 <vprintk_emit+440>
/usr/src/debug/kernel-5.14.0-427.42.1.el9_4/linux-5.14.0-427.42.1.el9_4.x86_64/./arch/x86/include/asm/vdso/processor.h: 13
0xffffffff87b9316b <vprintk_emit+427>:	pause
/usr/src/debug/kernel-5.14.0-427.42.1.el9_4/linux-5.14.0-427.42.1.el9_4.x86_64/kernel/printk/printk.c: 2046
0xffffffff87b9316d <vprintk_emit+429>:	movzbl 0x2915ddb(%rip),%eax        # 0xffffffff8a4a8f4f <console_waiter>
0xffffffff87b93174 <vprintk_emit+436>:	test   %al,%al
找到对应的源码看一下,就是卡在了这个console_trylock_spinning函数的的while循环中。
根据背景知识中的内容我们可以知道这是一直在尝试死循环读console_waiter,直到handover把锁转移过来把console_waiter置为false,而在这之前的printk_safe_enter_irqsave中正好关闭了中断。
所以可以合理推断是之前持有sem锁的owner一直没有handover写console_waiter,所以这里就关了中断之后一直循环等待最终导致hardlockup。
static int console_trylock_spinning(void)
{
......

        printk_safe_enter_irqsave(flags);

        raw_spin_lock(&console_owner_lock);
        owner = READ_ONCE(console_owner);
        waiter = READ_ONCE(console_waiter);
        if (!waiter && owner && owner != current) {
        WRITE_ONCE(console_waiter, true);
                spin = true;
        }
        raw_spin_unlock(&console_owner_lock);

        if (!spin) {
                printk_safe_exit_irqrestore(flags);
                return 0;
        }

        while (READ_ONCE(console_waiter))
                cpu_relax();
        spin_release(&console_owner_dep_map, _THIS_IP_);
        printk_safe_exit_irqrestore(flags);
        /*
         * The owner passed the console lock to us.
         * Since we did not spin on console lock, annotate
         * this as a trylock. Otherwise lockdep will
         * complain.
         */
        mutex_acquire(&console_lock_dep_map, 0, 1, _THIS_IP_);

        return 1;
}
可以通过以下操作验证我们上述的猜测:
console_waiter一直是true,然后console_sem中的counter是0说明现在sem确实被别人持有,然后wait_list指向自己,说明没有别的waiter,符合使用handover的特征。
crash> p console_waiter
console_waiter = $1 = true

crash> p console_sem
console_sem = $2 = {
  lock = {
    raw_lock = {
      {
        val = {
          counter = 0
        },
        {
          locked = 0 '\000',
          pending = 0 '\000'
        },
        {
          locked_pending = 0,
          tail = 0
        }
      }
    }
  },
  count = 0,
  wait_list = {
    next = 0xffffffff899e7ae8 <console_sem+8>,
    prev = 0xffffffff899e7ae8 <console_sem+8>
  }
}
然后我们查看一下这个sem的owner,是一个kwoker。
crash> p console_owner
console_owner = $3 = (struct task_struct *) 0xff16347e4de04680
crash> struct task_struct.tgid,pid,comm 0xff16347e4de04680
  tgid = 1463052,
  pid = 1463052,
  comm = "kworker/290:1\000\000",

crash> bt 1463052
PID: 1463052  TASK: ff16347e4de04680  CPU: 290  COMMAND: "kworker/290:1"
 #0 [ff49b5b50ea37e90] process_one_work at ffffffff87b2d292
 #1 [ff49b5b50ea37ed8] worker_thread at ffffffff87b2d860
 #2 [ff49b5b50ea37f18] kthread at ffffffff87b35a2d
 #3 [ff49b5b50ea37f50] ret_from_fork at ffffffff87a02c69
但是这个kworker执行了什么任务呢?看不到了。
这里我想了几种别的方式来尝试找一下蛛丝马迹来着,比如既然是查console_sem被谁持有,那么持有console_sem的函数会不会大概率打印一些log呢,从dmesg中可不可以找到一些信息?或者bf -f中有没有可能还存有一些信息呢?很遗憾,没找到什么。大模型还是厉害,给找到了方法:通过kwoker的task_struct找到kthread结构体,然后通过kthread结构体找到woker结构体,进而找到执行的func,可以看到是在执行fb_flashcursor函数。
crash> struct task_struct.worker_private ff16347e4de04680
  worker_private = 0xff163480e89abc00,
crash> struct kthread.data 0xff163480e89abc00
  data = 0xff16347f36eba6c0,
crash> struct worker.current_work,current_func,current_pwq,current_start,desc 0xff16347f36eba6c0
  current_work = 0xff1633bf5a41dcd8,
  current_func = 0xffffffff880ea1a0 <fb_flashcursor>,
  current_pwq = 0xff16353e7b4b8d00,
struct: invalid data structure reference: worker.current_start
看一下fb_flashcursor函数,console_trylock尝试加锁,然后执行完一些逻辑之后,执行console_unlock解锁。
这里,其实bt -r打印栈上所有内容后可以看到是执行到console_unlock了,所以其实是console_unlock内部执行出现了问题?
static void fb_flashcursor(struct work_struct *work)
{
        struct fbcon_ops *ops = container_of(work, struct fbcon_ops, cursor_work.work);
        struct fb_info *info;
        struct vc_data *vc = NULL;
        int c;
        int mode;
        int ret;

        /* FIXME: we should sort out the unbind locking instead */
        /* instead we just fail to flash the cursor if we can't get
         * the lock instead of blocking fbcon deinit */
        ret = console_trylock();
        if (ret == 0)
                return;

        /* protected by console_lock */
        info = ops->info;

        if (ops->currcon != -1)
                vc = vc_cons[ops->currcon].d;

        if (!vc || !con_is_visible(vc) ||
            fbcon_info_from_console(vc->vc_num) != info ||
            vc->vc_deccm != 1) {
                console_unlock();
                return;
        }

        c = scr_readw((u16 *) vc->vc_pos);
        mode = (!ops->cursor_flash || ops->cursor_state.enable) ?
                CM_ERASE : CM_DRAW;
        ops->cursor(vc, info, mode, get_color(vc, info, c, 1),
                    get_color(vc, info, c, 0));
        console_unlock();

        queue_delayed_work(system_power_efficient_wq, &ops->cursor_work,
                           ops->cur_blink_jiffies);
}
然后看一下console_unlock函数,重点是如果如果buffer里面有内容,则先flush,如果没有handover机制,则unlock,如果有handover,则在console_flush_all函数里面处理。
void console_unlock(void)
{
        bool do_cond_resched;
        bool handover;
        bool flushed;
        u64 next_seq;

        if (console_suspended) {
                up_console_sem();
                return;
        }

        do_cond_resched = console_may_schedule;

        do {
                console_may_schedule = 0;

                flushed = console_flush_all(do_cond_resched, &next_seq, &handover);
                if (!handover)
                        __console_unlock();

                if (!flushed)
                        break;

        } while (prb_read_valid(prb, next_seq, NULL) && console_trylock());
}
如果有handover的话,则在console_flush_all的流程里调用到console_lock_spinning_disable_and_check里对handover进行处理,包括sem的移交和console_waiter的写入等。
所以很明显,还没有执行到console_lock_spinning_disable_and_check的逻辑。
console_flush_all
  ->console_emit_next_record_transferable
    ->console_emit_next_record
      ->__console_emit_next_record
        ->console_lock_spinning_disable_and_check
通过bt -r看一下栈上还有哪些内容,发现有个serial8250_console_write+865。看一下__console_emit_next_record函数的片段。
所以其实就是执行到call_console_driver里面了。call_console_driver里面是遍历调用各个console的write函数。
       if (handover) {
                printk_safe_enter_irqsave(flags);
                console_lock_spinning_enable();

                /* don't trace irqsoff print latency */
                stop_critical_timings();
        }

        call_console_driver(con, write_text, len, dropped_text, atomic_printing);

        write_console_seq(con, seq + 1, atomic_printing);

        if (handover) {
                start_critical_timings();
                *handover = console_lock_spinning_disable_and_check();
                printk_safe_exit_irqrestore(flags);
        }
然后看一下serial8250_console_write+865附近。
0xffffffff881b9b80 <serial8250_console_write+816>:      call   *%rax
0xffffffff881b9b82 <serial8250_console_write+818>:      nopl   (%rax)
/usr/src/debug/kernel-5.14.0-427.42.1.el9_4/linux-5.14.0-427.42.1.el9_4.x86_64/drivers/tty/serial/8250/8250.h: 286
0xffffffff881b9b85 <serial8250_console_write+821>:      mov    0x240(%r15),%rdi
0xffffffff881b9b8c <serial8250_console_write+828>:      test   %rdi,%rdi
0xffffffff881b9b8f <serial8250_console_write+831>:      je     0xffffffff881b9b9b <serial8250_console_write+843>
/usr/src/debug/kernel-5.14.0-427.42.1.el9_4/linux-5.14.0-427.42.1.el9_4.x86_64/drivers/tty/serial/8250/8250.h: 287
0xffffffff881b9b91 <serial8250_console_write+833>:      mov    $0x6,%esi
0xffffffff881b9b96 <serial8250_console_write+838>:      call   0xffffffff881c05d0 <mctrl_gpio_set>
/usr/src/debug/kernel-5.14.0-427.42.1.el9_4/linux-5.14.0-427.42.1.el9_4.x86_64/drivers/tty/serial/8250/8250_port.c: 3452
0xffffffff881b9b9b <serial8250_console_write+843>:      movb   $0x0,0x238(%r15)
0xffffffff881b9ba3 <serial8250_console_write+851>:      jmp    0xffffffff881b9916 <serial8250_console_write+198>
/usr/src/debug/kernel-5.14.0-427.42.1.el9_4/linux-5.14.0-427.42.1.el9_4.x86_64/drivers/tty/serial/8250/8250.h: 182
0xffffffff881b9ba8 <serial8250_console_write+856>:      mov    0x220(%r15),%ebp
0xffffffff881b9baf <serial8250_console_write+863>:      jmp    0xffffffff881b9bbc <serial8250_console_write+876>
/usr/src/debug/kernel-5.14.0-427.42.1.el9_4/linux-5.14.0-427.42.1.el9_4.x86_64/./arch/x86/include/asm/irqflags.h: 122
0xffffffff881b9bb1 <serial8250_console_write+865>:      and    $0x2,%bh
/usr/src/debug/kernel-5.14.0-427.42.1.el9_4/linux-5.14.0-427.42.1.el9_4.x86_64/./arch/x86/include/asm/irqflags.h: 134
0xffffffff881b9bb4 <serial8250_console_write+868>:      je     0xffffffff881b9bb7 <serial8250_console_write+871>
/usr/src/debug/kernel-5.14.0-427.42.1.el9_4/linux-5.14.0-427.42.1.el9_4.x86_64/./arch/x86/include/asm/irqflags.h: 42
0xffffffff881b9bb6 <serial8250_console_write+870>:      sti
/usr/src/debug/kernel-5.14.0-427.42.1.el9_4/linux-5.14.0-427.42.1.el9_4.x86_64/drivers/tty/serial/8250/8250.h: 186
0xffffffff881b9bb7 <serial8250_console_write+871>:      call   0xffffffff87b8ed30 <__printk_cpu_sync_wait>
/usr/src/debug/kernel-5.14.0-427.42.1.el9_4/linux-5.14.0-427.42.1.el9_4.x86_64/./arch/x86/include/asm/irqflags.h: 26
0xffffffff881b9bbc <serial8250_console_write+876>:      pushf
0xffffffff881b9bbd <serial8250_console_write+877>:      pop    %rbx
/usr/src/debug/kernel-5.14.0-427.42.1.el9_4/linux-5.14.0-427.42.1.el9_4.x86_64/./arch/x86/include/asm/irqflags.h: 37
0xffffffff881b9bbe <serial8250_console_write+878>:      cli
/usr/src/debug/kernel-5.14.0-427.42.1.el9_4/linux-5.14.0-427.42.1.el9_4.x86_64/drivers/tty/serial/8250/8250.h: 186
0xffffffff881b9bbf <serial8250_console_write+879>:      call   0xffffffff87b8fd60 <__printk_cpu_sync_try_get>
0xffffffff881b9bc4 <serial8250_console_write+884>:      test   %eax,%eax
0xffffffff881b9bc6 <serial8250_console_write+886>:      je     0xffffffff881b9bb1 <serial8250_console_write+865>
/usr/src/debug/kernel-5.14.0-427.42.1.el9_4/linux-5.14.0-427.42.1.el9_4.x86_64/drivers/tty/serial/8250/8250.h: 115
这里,附近看到有调用__printk_cpu_sync_try_get,难道是在等printk_cpu_sync?
看一下printk_cpu_sync_owner,正好是334号cpu。看一下最开始hardlockup宕机的栈,正好就发生在334号cpu。恰好形成了ABBA死锁。
crash> p printk_cpu_sync_owner
printk_cpu_sync_owner = $1 = {
  counter = 334
}
结论
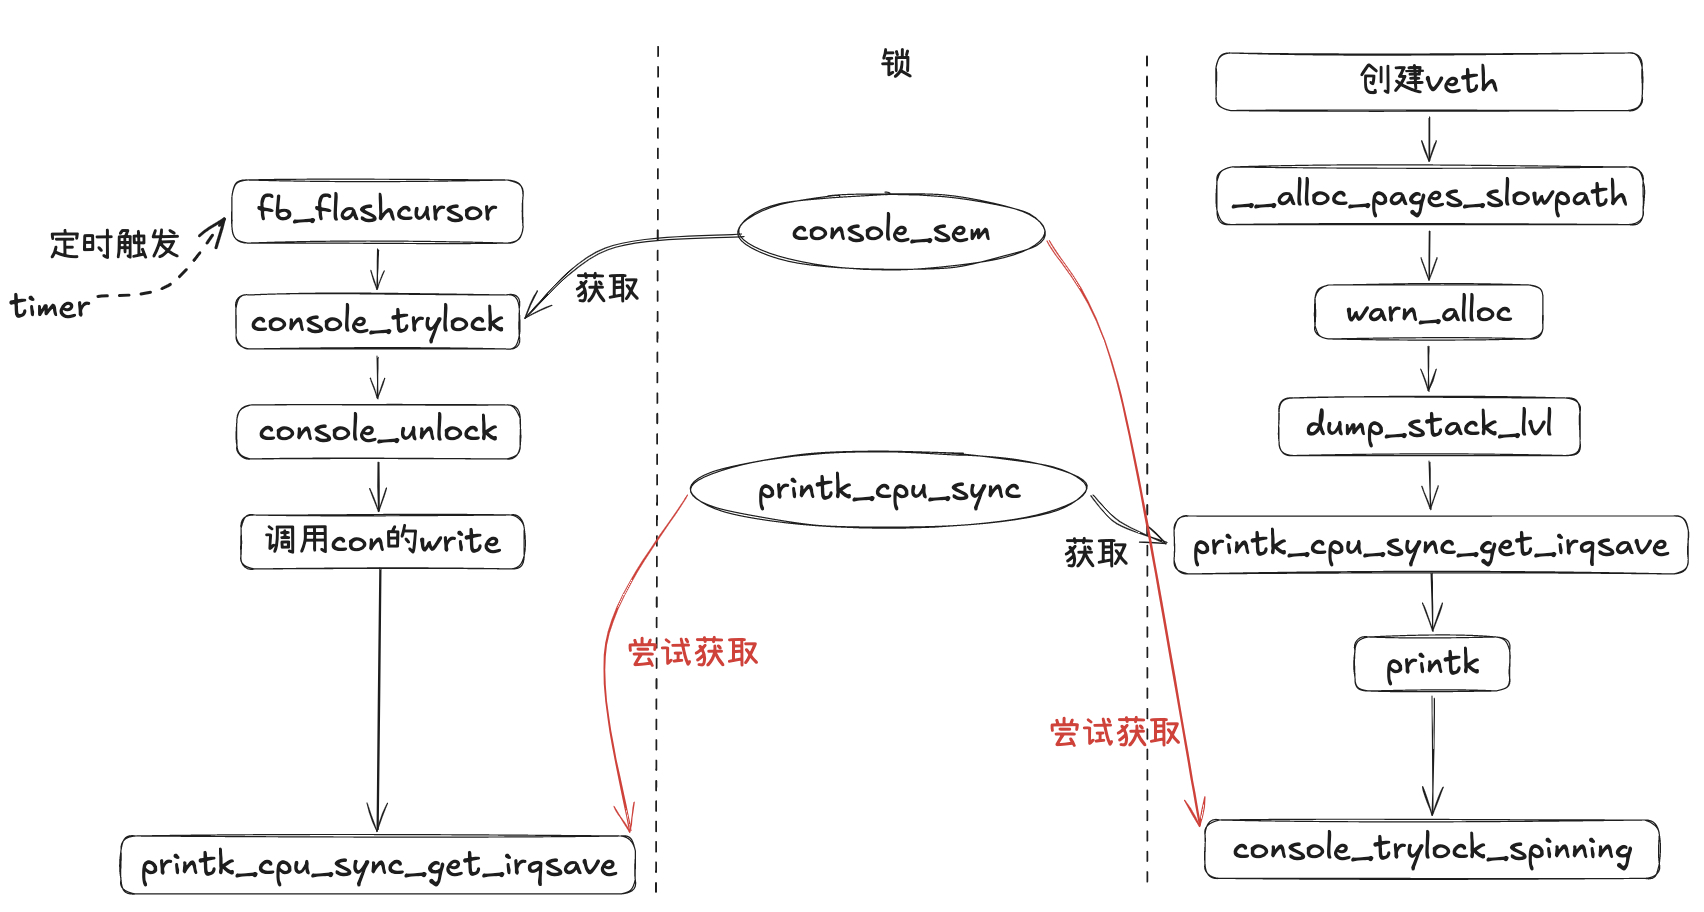
如图,fbcon周期性触发,获取console_sem然后在console_unlock路径中尝试获取printk_cpu_sync。而创建veth初始化的时候需要分配页面,快速分配失败走慢路径warn_alloc打印警告日志,它会先持有printk_cpu_sync,然后又尝试获取console_sem,因此两者互相等待形成死锁。
解决方法
上游中这个patch可以缓解这个问题,是在创建veth的时候使用kvcalloc来代替kcalloc,也就是不再强制去分配很大的连续的物理页面。
commit 1ce7d306ea63f3e379557c79abd88052e0483813
Author: Jakub Kicinski <kuba@kernel.org>
Date: Fri Feb 23 15:59:08 2024 -0800
 veth: try harder when allocating queue memory
而这个patch应该可以彻底解决这个问题,也就是在设计上,持有printk_cpu_sync的owner不应该等待其他锁,所以持有printk_cpu_sync的代码会把log延迟打印,这样就不会形成死锁了。
commit 0161e2d6950fe66cf6ac1c10d945bae971f33667
Author: John Ogness <john.ogness@linutronix.de>
Date: Mon Dec 9 12:23:46 2024 +0106
 printk: Defer legacy printing when holding printk_cpu_sync
参考
转载请注明来源,欢迎对文章中的引用来源进行考证,欢迎指出任何有错误或不够清晰的表达。可以在下面评论区评论,也可以邮件至 857879363@qq.com